Frequently Asked Questions
GrafCompounder 5.0
The Artificial Intelligence Tool:
An Assistant for the Rubber Compounder
Version 5.0 Released 30. July 2023
We always appreciate, if you have additional ideas we should consider and help us making this program the perfect assistant for your work.
What are the standard features in GrafCompounder?
- Calculation of specific gravity, cost per mass and cost per volume of each compound in "Input data" window as long as data provided in "Cost:" and "Density:" column.
- Merger: Incorporation of data from different sources into one worksheet, which may contain polymers of different
nature. This hould be stored in separate worksheets, but can be merged into one worksheet if needed. It is recommended
to work with compound data of similar, respective soluble polymers.
For example, you have a file with compounds based on NR and another file with compounds based on SBR or SBR/BR. These are accepted as miscible polymers. To merge them in one data file would increase the number of datasets, which is advantageous for compound calculation and prediction. - Avoid consolidating formulas of rubber with immiscible elastomers in a single worksheet, as their morphology significantly impacts mixing and compound properties. If opting to handle compounds with immiscible elastomers in one worksheet, exercise heightened awareness of this influential factor and exercise thorough caution when analyzing the results of any compound predictions. Currently, the influence of morphology on properties cannot be accurately calculated at this time.
- The "Code:" column serves a valuable purpose in reorganizing the "Ingredients:" column. This proves especially useful after copy/pasting additional data from another table or employing the merger function to integrate data from .gc files or table calculation programs. Furthermore, applying the "Code:" to the Properties: column allows for the organization of properties based on their assigned code numbers.
- Cost (per mass): can be set as a target in the criteria window. It's important to note that neither Density nor Cost (per volume), nor the sum of phr (parts per hundred rubber) for ingredients can be calculated before a compound is predicted.
- Frequency Distribution Diagram: These diagrams showing the spread of each ingredient or property in the dataset.
Why does GrafCompounder 5.0 not use an ingredient library?
No Ingredient Library - By Design- Confidentiality: Rubber compound data is highly protected. Formulations are rarely shared or published across the industry.
- Non-transferability: Ingredient performance depends heavily on specific equipment, raw materials, and process conditions - making standardized library data unreliable.
- Full data privacy
- Maximum accuracy and relevance
- No restriction from fixed ingredient lists
What are the new features in GrafCompounder 5.0?
- "Display on Multiple Screens: The GrafCompounder 5.0 can be displayed and
operated simultaneously across multiple screens.". - File Name Display: The file name (not the completed file path) is now shown in various windows, such as the Frequency Distribution Diagram, 2D Scatter Plot, and 3D Scatter Plot.
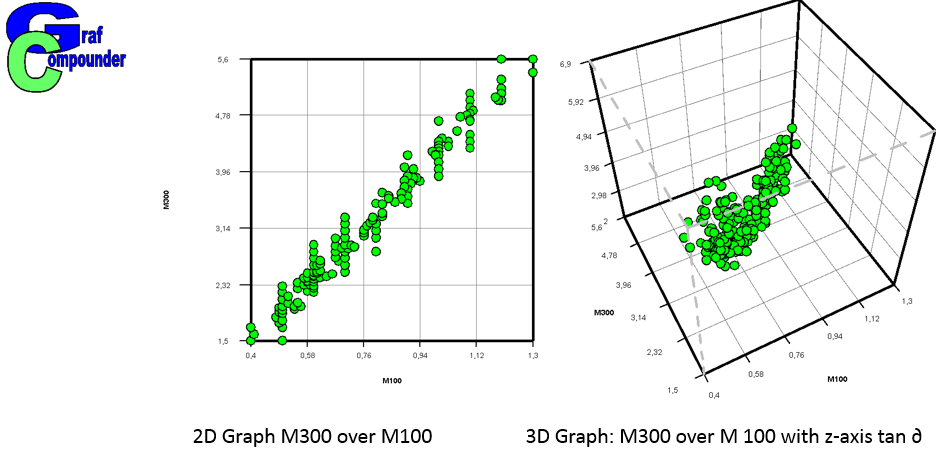
- Trend-line and Correlation Coefficient: A trend-line has been added to the 2D Scatter Plot, and the correlation coefficient is calculated and displayed in the 2D Scatter Plot.
- Disable Recipe in Scatter Plot: In the scatter plot, you can disableImproved Visibility in 3D Scatter Plot: In the 3D Scatter Plot, the selected data point is made more visible with a shadow on the x/z and y/z cube sides. a recipe by clicking on a button, which removes it from the diagram.
- Plus Sign Support: The software now accepts the plus sign (+) just like the minus sign (-) in previous versions, which is useful for values pasted from table calculation programs.
- Enhanced Clipboard Data Paste: You can paste data from the clipboard into the criteria window with more flexibility, allowing you to paste tabular data into specific positions in the criteria grid.
- Mixtures Criteria Display: Mixtures created via automated mixing now display their criteria when hovering over the name of the compound, and these criteria snapshots persist in *.gc files.
- Handling Missing Ingredient Values: Ingredients in compounds with missing values (empty cells) are not displayed in the scatter plot. An explicit zero value is required to make the ingredient (with 0 phr) visible in the diagram.
- 2D and 3D Diagrams: The software now offers 2D (x and y axis) and 3D (x, y, and z axis) diagrams to help users search for correlations between properties or ingredients/properties.
- Text in Frequency Distribution Diagram: The Frequency Distribution Diagram now displays text indicating compounds that are ignored due to reasons such as zero ingredient value, bad ingredient value, or bad/unknown property values. This text is only displayed if at least one recipe is ignored in the diagram.
How does GrafCompounder 5.0 predict a compound with its formula & properties?
- In GrafCompounder, each recipe is treated as a data point, comprising ingredient values and corresponding measured properties. These data points can be represented as n-dimensional vectors, where n denotes the total number of ingredients plus associated properties and their respective values.
- GrafCompounder uses an advanced engine and algorithm designed for cross-linking these data points through simple interpolation. By intelligently blending and interpolating the data,
- GrafCompounder employs a so-called walking gradient algorithm that seeks the ideal compromise in case of conflicted targets. This process, commonly referred to as a "Fitness function" in AI terminology, ensures meticulous recipe crafting that aligns with the user's standards.
Would the tool still deliver accurate predictions if my formulation data is incomplete or missing certain test results?
- Missing ingredient values are interpreted as zero, not as unknown allowing for flexible recipe structures.
- Missing property values are treated as absent and will exclude the formulation from relevant analyses.
Our historical data is already fixed - shouldn't these best practices be applied to future data collection instead?"
- Rheological Tests
- Mooney (125°C): Mmin, t5, t35
- Or MDR (160?°C): Mmin, ts2, ts5, tc90, MH
- Physical Properties
- Hardness, M100, M300, TS, EB
- (M300 - M100) for reinforcement assessment
- Compression set (e.g., 24 h at 70?°C) for crosslink stability
- Specific gravity for quality control
How to improve the accuracy and of compound prediction?
- Laboratory Mixing Machine: The most significant influence on uncertainty and variation arises from the laboratory mixing machine. Often, this equipment may not be state-of-the-art, introducing potential inconsistencies. To verify the repeatability of mixing, key indicators such as Mooney viscosity, Mooney scorch minimum, or Vulcameter Fmin should be measured at lower temperatures for improved resolution. It is recommended to develop a standard mixing procedure for each polymer and do a couple of mixing trails repeats in another week. Calculate the mean and the standard deviation.
How to check and improve the quality of datasets?
There are difficulties to download and install Grafcompounder: What can be done?
I cannot download the GrafCompounder setup.exe file and my browser just displays a warning message "...exe was blocked because it could harm your device"?
This could happen with the "Microsoft Edge" browser, which might block a downloaded file it does not recognize yet. To unblock the downloaded file, position your mouse cursor over the warning message. Then a button with three dots "..." should appear right of the warning message. Press that button and then choose "Keep".What can I do when running the GrafCompounder setup exe file just gives me a popup titled "Windows has protected your PC"?
This might happen when Windows decides to check back with the user because it does not recognise the file yet. To proceed with the installation, click on the "More info" text in the popup. A "Run anyway"-button will appear, which you will need to click.What to do when running the GrafCompounder setup.exe file does nothing and no setup window appears?
In some cases, this issue has been resolved by running the setup.exe file in compatibility mode (right-click on the file, select "Properties", then select the "Compatibility" tab). In other cases, it might help to run the setup exe file as admin (right-click on the file, select "Run as administrator").The difference of the physical properties between calculated compound properties and confirmation experiment is quite large.
What can be the reason?
One major concern can be the precision of measurements. According to my own experience
batch to batch variation is quite small in laboratory size mixers but larger in plant scale mixers to some extend.
Normally the batch to batch variation and its effect on physical properties is well known: either from quality control measurement and analysis
or from repeated testing in laboratory scale. But if it is not known, I urge you to evaluate. - One method is a Gage R&R study. Advise and templates for table calculation programs can be found on the internet.
- The other method would be the use of Statistic Experimental Design (DoE) in your Laboratory. The analysis of the measurement error is inherent in the software (See for example Design Expert® from Stat Ease Inc.).
- As a third method: Laboratories can participate on Round Robin Tests, which are offered and organized by several institutes and organizations around the world.
Is there any proof of linear relations between ingredients in a rubber formula and its properties?
How to store compound data?
How to store compound data with higher Version of GrafCompounder than 2.004?
Is it possible to open more than one file at the same time?
Which compound properties should be stored in the Database?
How can I compare the compound cost between the newly calculated compound and one of the compounds in my database?
The confirmation experiment gives not the expected result! What should I do?
There are missing data in the properties area. What should I do?
In the compound data base there are Polymers with different polarity. How to handle?
If I want to evaluate new ingredients for my compound, is it possible
to use the GrafCompounder?Is it possible to calculate with negative numbers, like change of Hardness -1°ShA for example?
In the tutorial there are Code Numbers for the ingredients, which we do not use. Is it possible to replace the Code Numbers by others?
- A - Polymer
- B - Filler
- C - Process Oil
- A001 = Polymer 1
- A002 = Polymer 2
- PR001 = Property 1
- PR002 = Property 2
In case there are Oil extended Rubbers used in the Formulas, will GrafCompounder calculate correctly?
To allow GrafCompounder calculating correctly, the oil extended rubber must denoted in the following way: In case of Merger of different data files is there a simpler method instead of having a code for all the ingredients and still be able to organize the data in the usual way?
The problem is, that ingredients have a purchase code, but this code is not helping and any change would take too much effort beside its difficulty.- A - Polymer
- B - Carbon Black
- C - White Filler
- D - Plastizicer
- E - .....
GrafCompounder was intentionally developed without a predefined ingredient library. As explained in our presentation at the CSC Rubber Division Meeting, Ottawa 2025, this design decision is based on two core reasons:
Instead, GrafCompounder 5.0 uses your own real-world data to deliver practical optimization results through advanced genetic algorithm AI - not based on assumptions or generic libraries.
GrafCompounder 5.0 calculates from your database obtained with from your process - not from someone else´s library.
These features enhance the functionality and usability of the program, making it easier for users to analyze and visualize data related to properties and ingredients.
Yes. The system is designed to work effectively even when some datasets are incomplete. If certain property values
(e.g., abrasion resistance) are missing and those properties are required for analysis, the platform automatically excludes
those entries from modeling. This dynamic filtering ensures that only complete and relevant records are used in predictions,
helping maintain output quality.
It's important to differentiate between formulation inputs and measured properties:
Exactly. While historical data may be limited by how it was originally gathered, implementing a consistent testing protocol moving forward can significantly improve the quality and usability of future datasets. Establishing standardized property measurements ensures that new formulations can be effectively modeled and compared, even when combined with older records. A recommended baseline for future data collection might include:
Capturing this core set of properties in all future projects helps build a more robust and model-friendly dataset over time.
What does influence compound property variation?
By addressing these influential factors, you can minimize compound property variation and enhance the reliability of your results in compound prediction.
Optimizing Dataset for Enhanced Predictions:
Optimizing Dataset for Enhanced Predictions:
Are you seeking a streamlined procedure to enhance the predictability of your dataset? In the production of rubber compounds, both in laboratories and manufacturing, variations between batches and measurement errors during subsequent testing can significantly impact data quality. This is compounded by uncertainties surrounding historical databases, including unknown mixing procedures, raw material origins, and measurement accuracy.
For an AI program like GrafCompounder, distinguishing between accurate and less accurate values becomes a challenge. One effective strategy is to eliminate inaccurate measurement values, a process facilitated by examining properties based on their correlation. Properties are interdependent through crosslink density - if loading is held constant, as highlighted in literature, such as F. R. Eirich's "Science and Technology of Rubber" (Academic Press 1978).
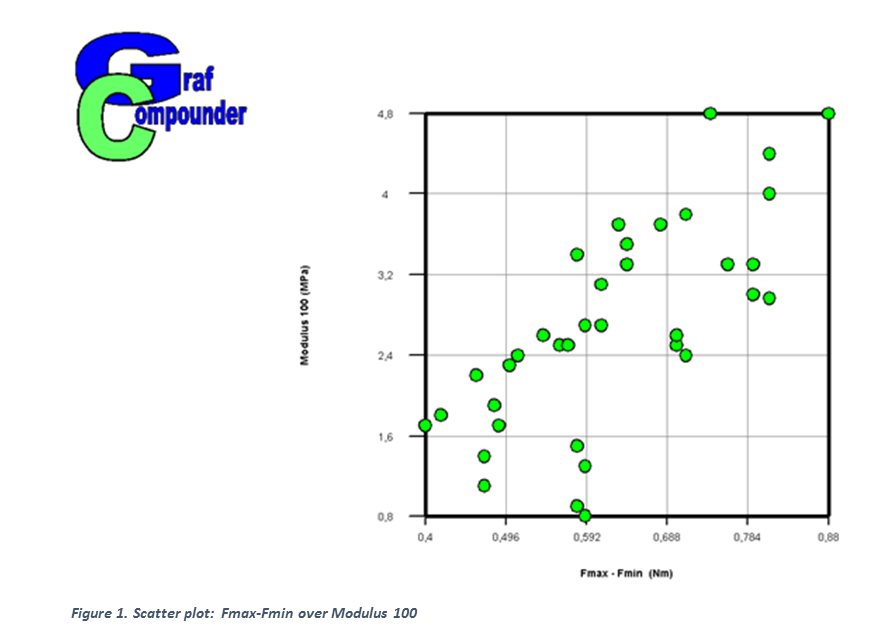
Consider the correlation between hardness and modulus or Fmax-Fmin and modulus as simple examples. This issue can be addressed using the correlation graph in GrafCompounder. In a practical example involving data from multiple Design of Experiments (DoE), the correlation between Fmax-Fmin and Modulus 100 is illustrated. Users can click on individual data points to deactivate associated compounds, refining the correlation. After clicking "Refresh recipes," the result is a "cleaned data set" that significantly improves the accuracy of compound predictions.
While this procedure is valuable, there is an inherent need to continually enhance repeatability and accuracy, ultimately working towards making such cleaning procedures obsolete.
The other concern is the measurement error in the testing laboratory. There are a couple of methods / procedures to follow, if there is a problem.
This is the case very often, if data are transferred by hand into the database but not electronically. You need to verify the data in your database either one by one, which is not possible in larger sets of data. At least the data of the compound used for calculation by the GrafCompounder software should be reviewed. Compounds with faulty data should be excluded from further calculations. You may decide to repeat measurements and make correction of the datasets as a corrective action alternatively.
If you analyze a lot of experiments done according the statistic experimental design (DoE) procedure, you have to notice, that almost all relations between ingredients, like fillers and oil, and the physical properties of the compound are in deed linear, made with this ingredients. If Design Expert® is your program of choice, you can visualize these relations with the graphical optimization function. It is easy to create an overlay plot of all physicals included in your research, if their values are put in the "criteria - upper limit" box. The y,x - axis show the factors (filler, oil), the contour lines the value, slope and linearity of the responses (physical properties). The following figure gives an example of an oil / filler experiment based on natural rubber (NR), which was performed recently.

The factors and responses are shown on the left side of the figure.
The author has evaluated numerous investigations similar to the one above.
Even if a none linear approach is suggested by the DoE software, it was found,
that a linear approach is sufficient for almost all cases included in this evaluation, taken into account measurement and experimental errors.
If it can be said truly, that linear relations between ingredients and physical properties exist,
then it seems justified, to use historical or happenstance data sets to perform compound calculations.
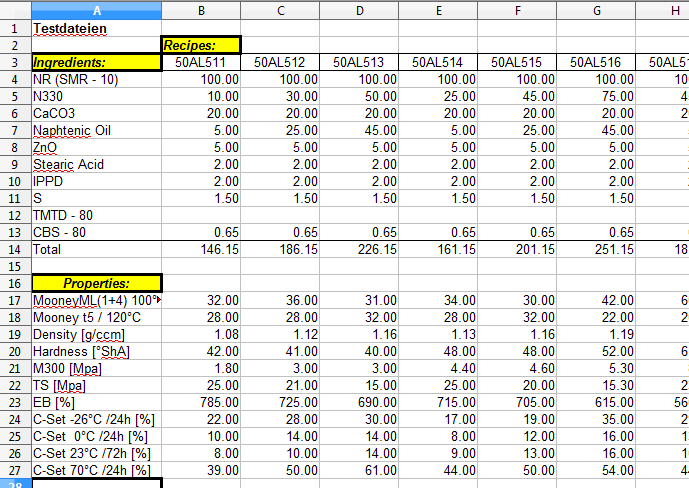
Working with version 1..1 compound data are stored in a calculation program like Excel® or Open Office® Spreadsheet. In Colum 1 header is called Ingredients:, in the same column in a cell further down it is called Properties:. In the second column with the first recipe in a cell above the name of the recipe you put in Recipes:
The data are transferred into the GrafCompounder with copy and paste.
The following table is shown as an example:
In GrafCompounder Version 2.004 and higher: The compound data can be stored directly in a xx.gc format,
which is specific for the software. It can only opened with the GrafCompounder as long as you have inserted the licence key.
Please see the new tutorial for this and newer versions.
GrafCompounder Version 2.004 and higher: A data file can be open directly with double click - right mouse button - on the File
in Windows Explorer®. Before double clicking the file make sure, that you have inserted the licence key.
If a second ..gc file gets a double click, this file will be open in a new window.
It is recommended, that all measurable compound properties should be stored in the database. Especially the basic physical properties should be completly stored. If one of this properties is a target of the calculation, the compound with missing data will be ignored, means not included in the calculation.
If the material cost of all the compounds in your database is one of the property, the GrafCompounder will calculate the material cost of your compound like any other property. Of course you can make cost a target and even give cost a weight.
Because cost - as we say: is one of the important physicals - it is recommended, that the data stored in the database consist of basic physicals and cost.You should control every compound used for the calculation. You may start with the compound, which is used at the highest percentage.
Mostly one of the properties may show a larger difference, the tensile at break for example. If you have identified a compound with a property value, which is suspicious, you may disable this compound and recalculate.
Investigate what has changed between the first and the second calculation. Compare the property of the compound after the second calculation with the compound property, you got through the confirmation experiment.
Most likely this analysis will be the prove, that a compound with a faulty data is detected.
You either disable this compound when running further calculations, or you eliminate this compound from your original database.
Empty cells in the "property:" portion of the "Input data" table would represent missing data.
A compound with an empty cell in "properties:" section will be excluded from calculation automatically.
As soon as you put a value in the "criteria" section in the same row, the compound name cell turns yellow to indicate exclusion.
In contrast, an empty cell in the "ingredient:" means, this specific ingredient is not in the compound.
The GrafCompounder will take the empty cell as Ingredient at 0,00 phr, which gives the correct
calculation for the final formula, if the resulting compound is composed including this compound.
As an example, ingredient A is set as 1,00 phr in compound 1 and in compound 2 there is an empty cell instead.
It indicates, that compound 2 contains no ingredient A. This cell is automatically assigned 0,00 phr for ingredient A.
In a blend of 50% compound 1 and 50% compound 2 the value of ingredient A will be 0,50 phr in the
calculated formulation, which would be the same value
for ingredient A of a physically blended compound 1 with compound 2.
What one has to consider, if there are compound formulas in the database with different polarities is the question, whether the polymers are insoluble or soluble. An estimation can be made, if one investigates the polarity scale (see “CRC Handbook of chemistry and physics” or “polymer handbook” - Brandrup, Immergut). If polymers insoluble, the effect on physicals is none linear and the simulation result with the GrafCompounder will be misleading. Even the author got a solution for an EPDM / SBR Blend (EP1444279A4) with the help of the GrafCompounder, extra care must be taken in interpreting the results of a simulation. Still the best and safe way to handle such problem, the compounds containing an insoluble polymer should be disabled and the calculation should be done without those recipes.
In case of the evaluation of new ingredients there is nothing in a historic database, which can be calculated. Without any experiments from the past, you can not conclude on unknown effects or correlations. The recommendation would be, that one evaluates the ingredients with the help of statistic experimental design or by any other means. The formulas and results can be used to create a database. Even if the database is small, because of the limited number of experiments done and stored, the GrafCompounder has no restriction on the size of a database.
In case of negative numbers, which you may have as a result of a property change after storage in hot air or media,
you need to consider the number format only.
Between the minus (-) sign and the number there should be no space. If there is a space in between, the cell would turn yellow,
indicating that this value is not accepted as a number by the GrafCompounder.
As soon as a space is eliminated, the yellow colour will disappear.
You are free to use any Code Numbers you like or given in your database system. It does not matter whether they are simply alphanumeric or mixed letter and number. My preference was to use a letter for a class of ingredients followed by a number for the ingredient in that class:
For example:
and so far for all other ingredients. To avoid number confusion it is recommended to put them in a worksheet in a table calculation program.
The same procedure is required for Properties, because in different worksheets there are not always the same nor have exactly the same name. I have chosen:
Please use a different worksheet to administer the property code numbers.
Rubber 100 phr / Oil 50 phr: Rubber 150 phr
Rubber 100 phr / Oil 75 phr: Rubber 175 phr
You should not denote the oil extended rubber 100 phr and then have specified all ingredients to 100 phr.
In case of a 50 phr oil extended rubber it would mean, that the rubber content in the formula would be 66,67 parts.
It would not be inline with the other formulas in which all ingredients are normalized on 100 phr rubber.
I would suggest, that you group the ingredients in a simple way:
The A - Polymer portion is shown in the example:
| Code: | Ingredients: |
|---|---|
| A | SBR - 3 |
| A | NR 20 |
| A | SBR - 1 |
| A | NR 60 CV |
You need to do this operation in the same way for the
A -, B -, C - , D -, E - ..... Ingredients.
The table in the example above would then look like this for the polymers:
| Code: | Ingredients: |
|---|---|
| A | NR 20 |
| A | NR 60 CV |
| A | SBR - 1 |
| A | SBR - 3 |
You would need a bit more time to organize larger data files after a merger, but it avoids a larger effort of preparation.
Please do not forget the code for the Properties. The description above is applicable for the properties in the same way.
Please see the tutorial data [Demo data (advanced)] implemented in the program.